SECTION 6:
FOCUS ON ONLY THE
FACULTY FOR 2003
SECTION 6:
FOCUS ON ONLY THE FACULTY FOR 2003
INTRODUCTION
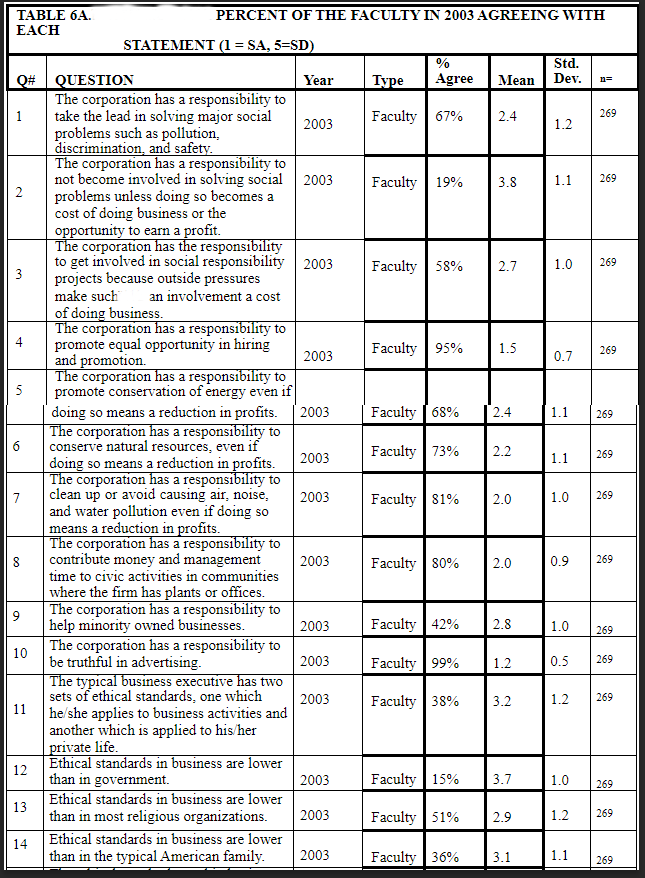
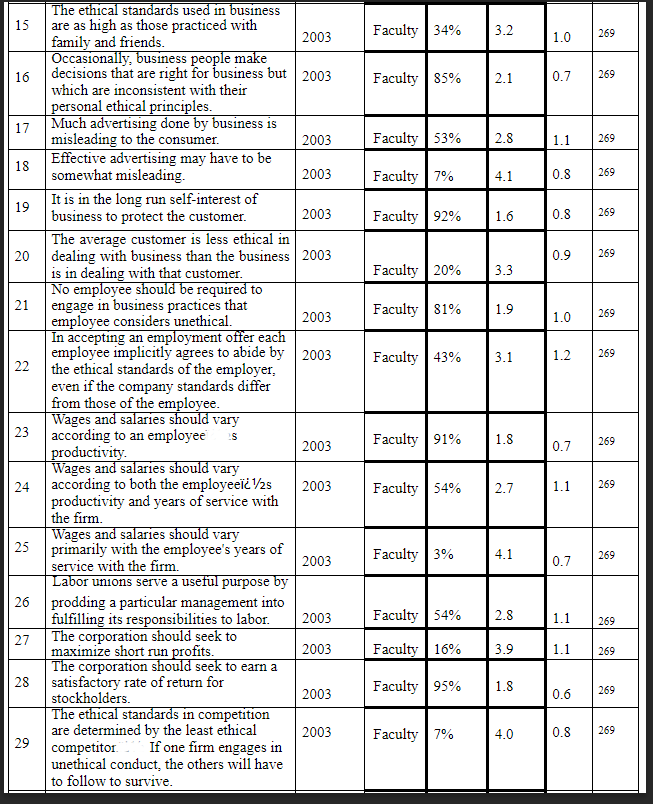
In this section, the
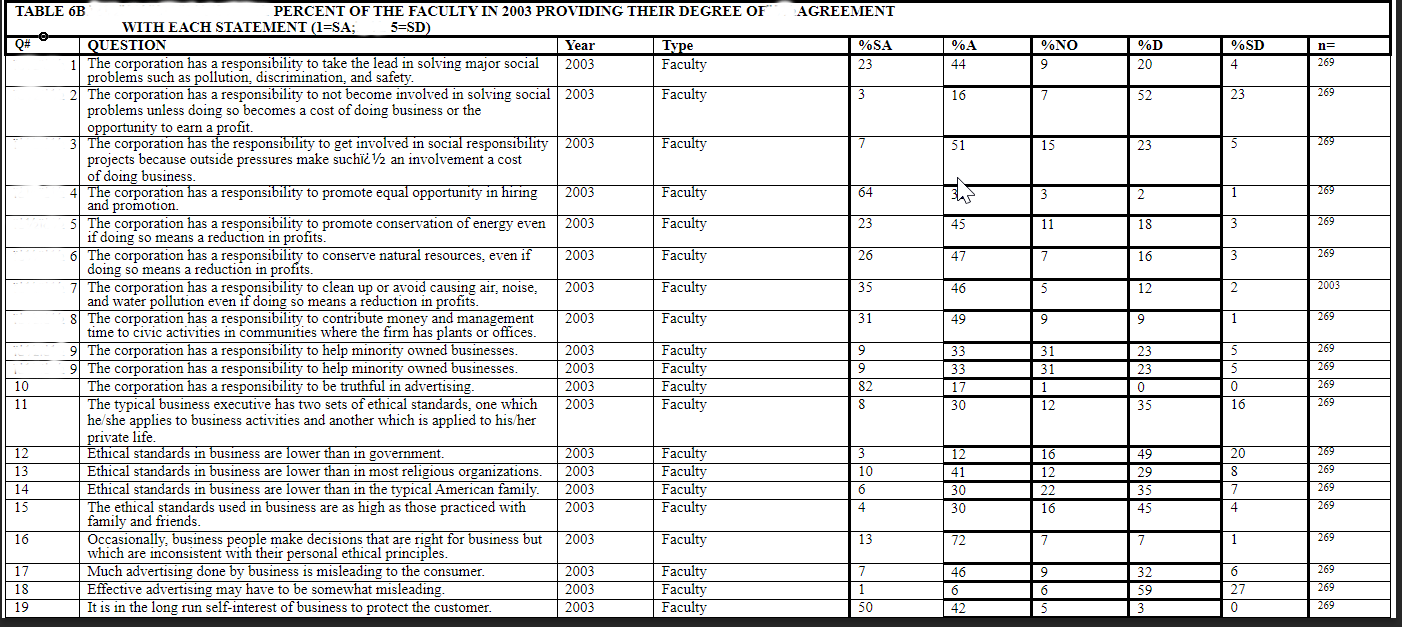
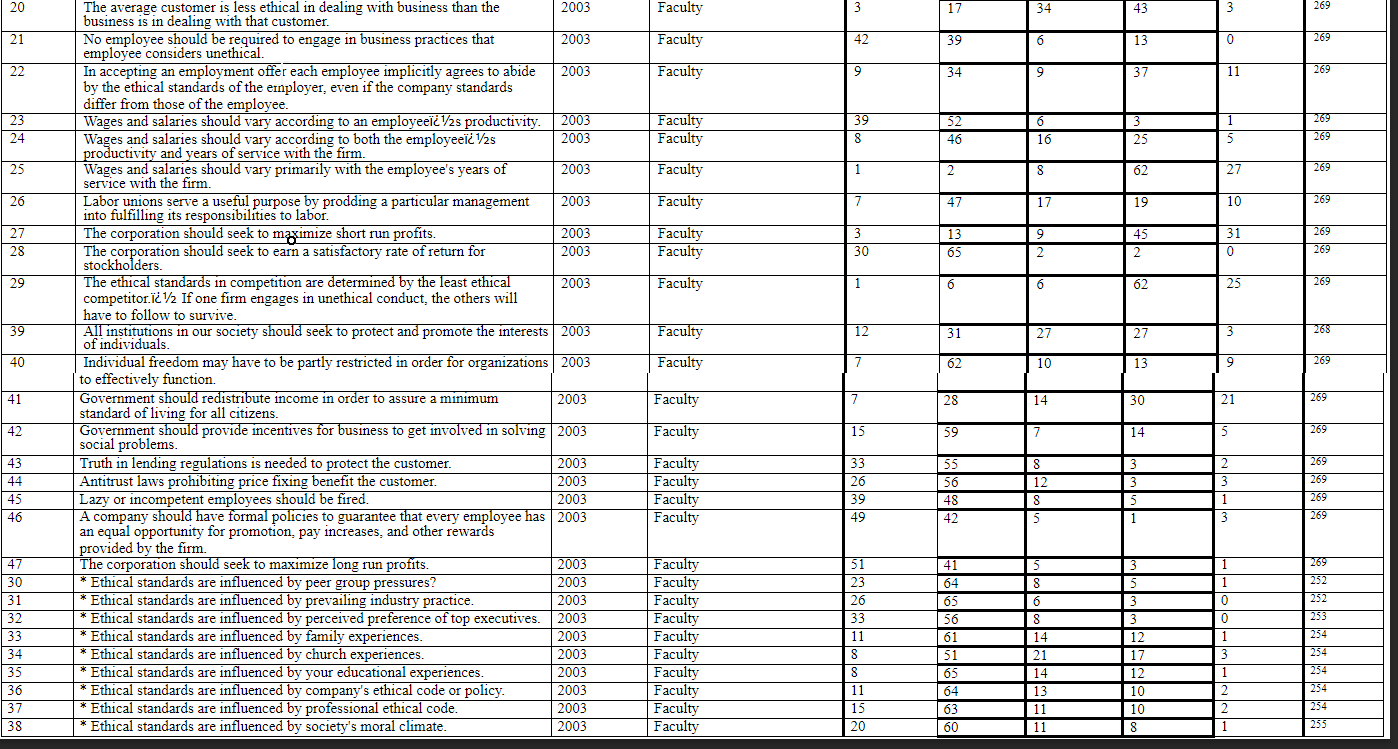
focus is only on the faculty for the 2003 study. Table 6A presents a
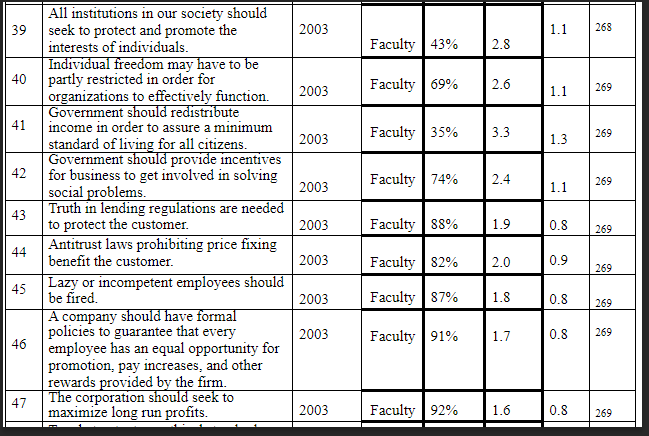
summary version of the information for each of the 47 attitudinal questions. For each question, the percent that agreed with each statement is
given. In addition, the average response (low is
positive) and the standard deviation for each question are provided. The number of responses completes the information for each group
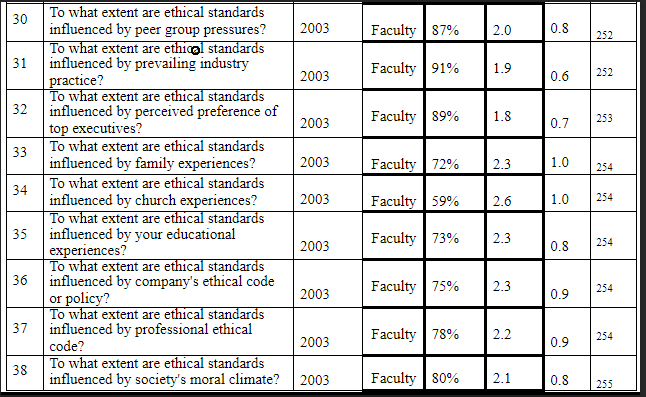
for each question. Questions 30 to 38 are given at the end of the
table since their answers should have reflected to what extent instead of a SA to SD perspective. See Table 6B for a clearer understanding of these questions. Table 6B gives the percentage of respondents who either Strongly
Agreed, Agree, gave No Opinion, Disagreed or Strongly Disagreed for each
question.
ANALYSIS
One can examine the
differences in the actual responses in these two tables depending upon his or
her interest in the particular question and/or group. A detailed analysis of the information in this
section is beyond the scope of the project.
Source: 2003 Study of Ethics
* The actual question on the questionnaire was * To what extent are ethical standards influenced by